

Agent Observability
Search, Analytics and Export
Query LLM traces and spans in GGX with a one-line query language, promote metadata dimensions, chart traffic, latency and cost, save views, and export CSV or JSON Lines.
The query box
Section titled “The query box”The Traces and Spans tabs have a query box that takes one line, for example:
status = error and model ~ gpt-4o and latency_ms > 2000- Operators:
=,!=,>,>=,<,<=,~(contains, any case) andin (a, b), combined withand,or,notand parentheses. Quote values that contain spaces. - Help as you type: the box suggests field names and values, a help panel lists every field, and a mistake is highlighted where it is.
- Missing values: a comparison against a value a trace does not have is false.
| Searching | Fields |
|---|---|
| Traces | trace_id, name, status, environment, service, session_id, user_id, deployment_id, pipeline_version_id, latency_ms, input_tokens, output_tokens, tokens, cost, currency, span_count, error_count, tool_calls, model, tag, flag, input and output (contains only), score.<name>, metadata.<key>, span(…) |
| Spans | trace_id, span_id, name, kind, status, provider, model, environment, service, session_id, user_id, tool, agent, cost_status, currency, latency_ms, ttft_ms, input_tokens, output_tokens, tokens, cost, health, input and output (contains only), attr.<key> |
More examples:
score.helpfulness < 0.5 or flag = loopmetadata.customer_tier = "gold" and not environment in (dev, test)span(kind = tool and status = error) and span(model ~ gpt-4o)score.<name>compares a score’s number, or its label when you give text.span(…)finds traces that contain a span matching the condition inside. With twospan(…)terms, the trace must contain a span matching each.
A query holds up to 32 conditions and three span(…) terms. A span(…) search follows at most 1,000 traces: when there were more, the page says its results are a lower bound.
The Spans tab
Section titled “The Spans tab”Spans searches every step of the traces in your range at once: every tool call, model call and retrieval. Sort by start time, duration, cost or tokens, and select a row to open its trace with that step selected.
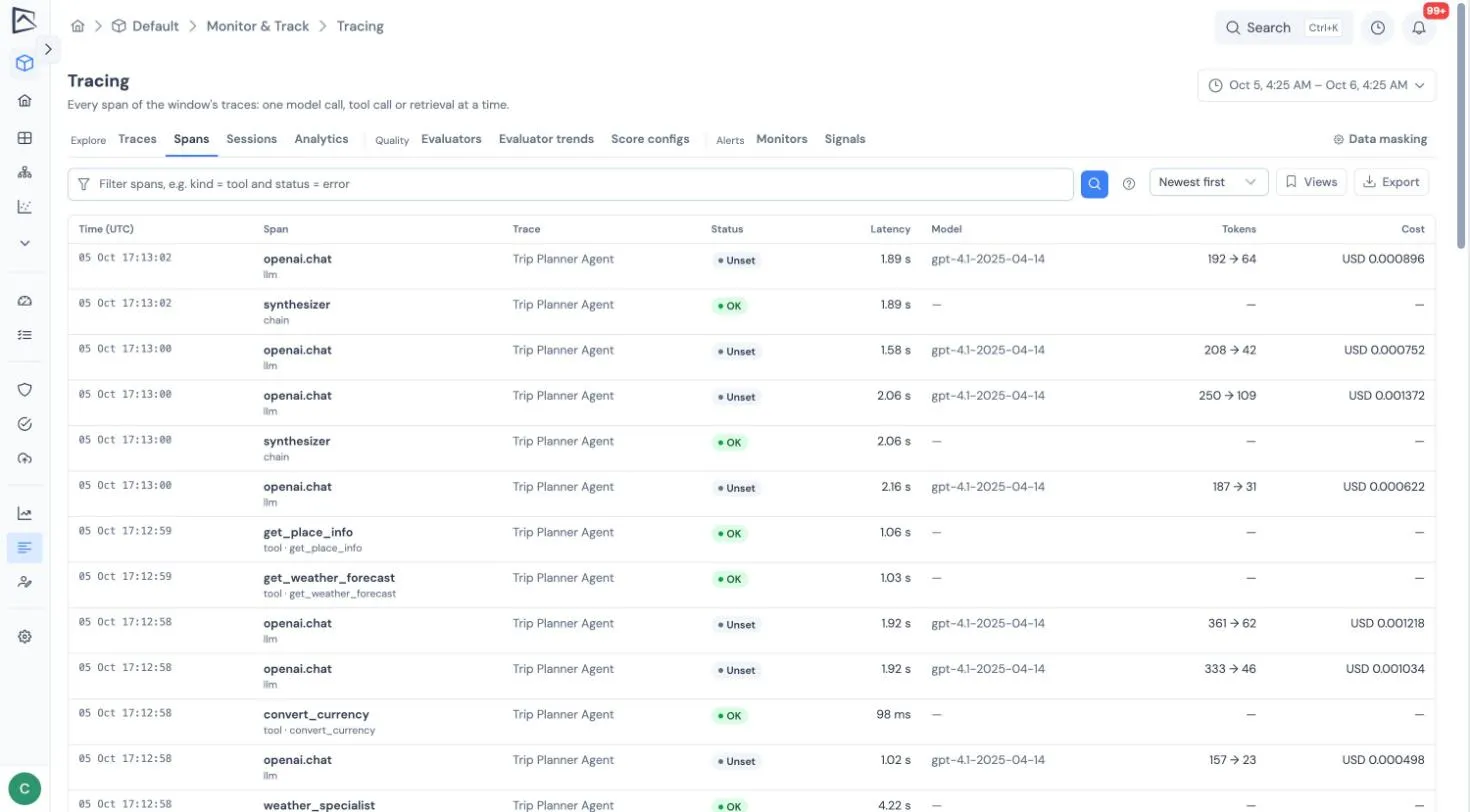
A search reads a bounded number of stored spans (fewer when it looks inside inputs, outputs or attributes); if it stops early, the page says there may be more. Adding a condition on kind, name, status or latency_ms keeps searches quick.
Metadata dimensions
Section titled “Metadata dimensions”A project can promote up to 10 of its own attribute keys, such as app.version or metadata.customer_tier, to dimensions. Set them under Tracing → Data masking → Metadata dimensions.
Each trace takes the key’s value from its root span, then any span, then the resource, after masking. Dimensions then appear as filters in the Traces sidebar, as metadata.<key> in queries, and as a grouping in Analytics. Only traces received after a key is added carry it.
Analytics
Section titled “Analytics”The Analytics tab charts traffic, error rate, latency (50th, 95th and 99th percentile), cost per currency, tokens and agent flags over the selected range.
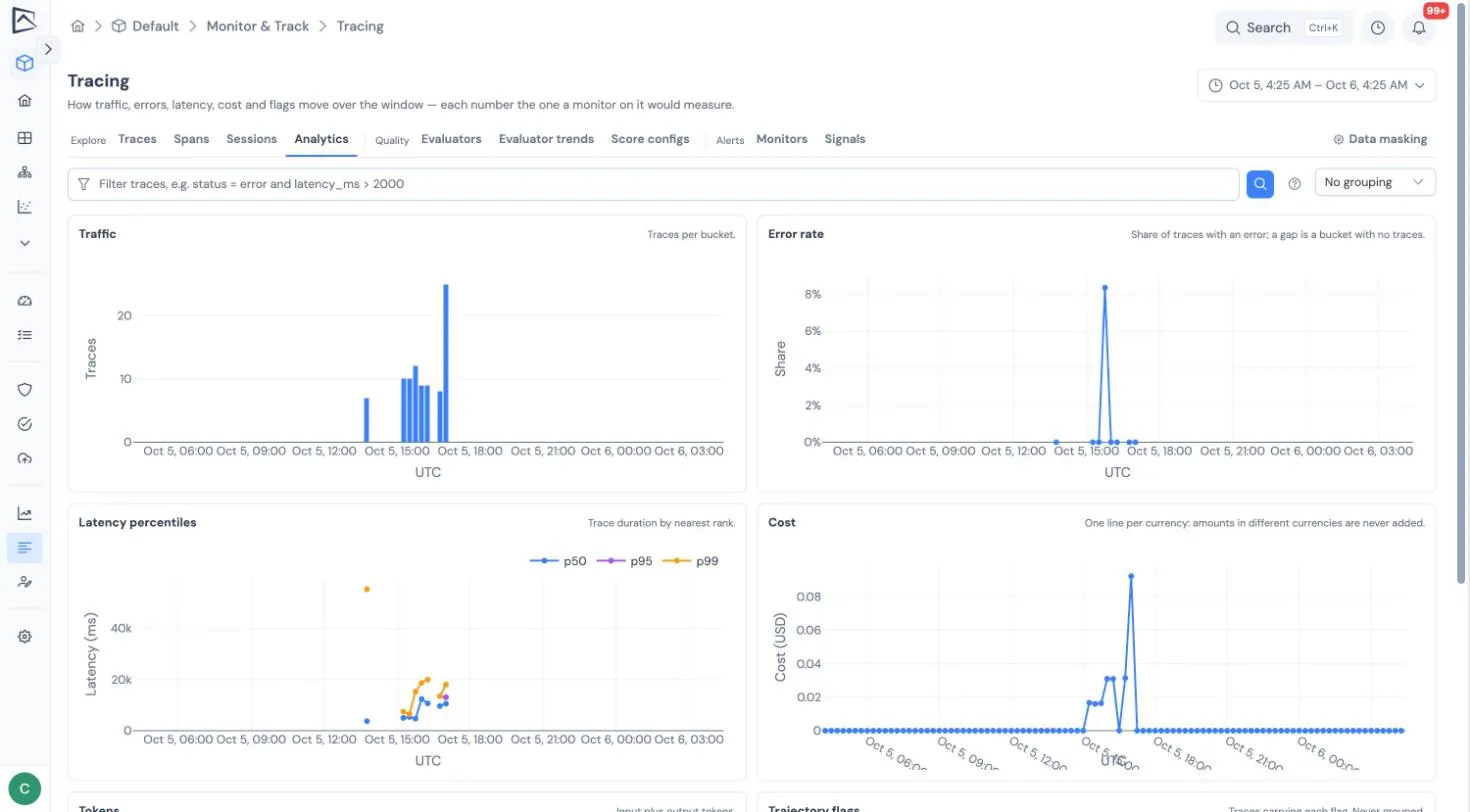
- It uses the query and filters from the Traces tab and names the ones in force, with a button to clear them.
- Group the charts by environment, trace name, deployment, model or a dimension to compare the five largest groups, with the rest shown as Other.
- Every number is computed exactly as monitors and the summary tiles compute it.
- Each chart has a text summary for screen readers.
The summary tiles on the Traces tab also show a small trend line. Moving between Traces, Sessions and Analytics keeps your range and filters.
Saved views and columns
Section titled “Saved views and columns”- Views on Traces, Spans and Sessions save the filters, query, range, columns and sort under a name. A view is yours unless you share it with the project, which needs write access to the project. Only its owner can change it.
- Columns on the Traces list chooses which columns show. Your choice is remembered in your browser and saved with views.
Export
Section titled “Export”Export downloads the Traces list or a Spans search, as filtered and sorted, as CSV or JSON Lines.
- Up to 50,000 rows, with content masked. Span exports contain summary columns only.
- When a file is cut short, its last line and the page say so.
- CSV cells a spreadsheet would run as a formula are neutralized.
- One export per person at a time; when the service is busy, the page says how long to wait.
- Every export is recorded: who asked, when, for what, how many rows, and whether it was cut short. Organization admins can list all exports; everyone else sees their own.
What to read next
Section titled “What to read next”- Exploring traces: the trace list and the span inspector.
- Monitors: alert on the same measures the Analytics tab charts.
- API reference: the search, time-series and export endpoints.