
Agent Observability
Exploring Traces
Read and debug LLM traces in GGX: the trace list, time ranges, the single-trace panel, the span inspector, error details and data-quality flags on model calls.
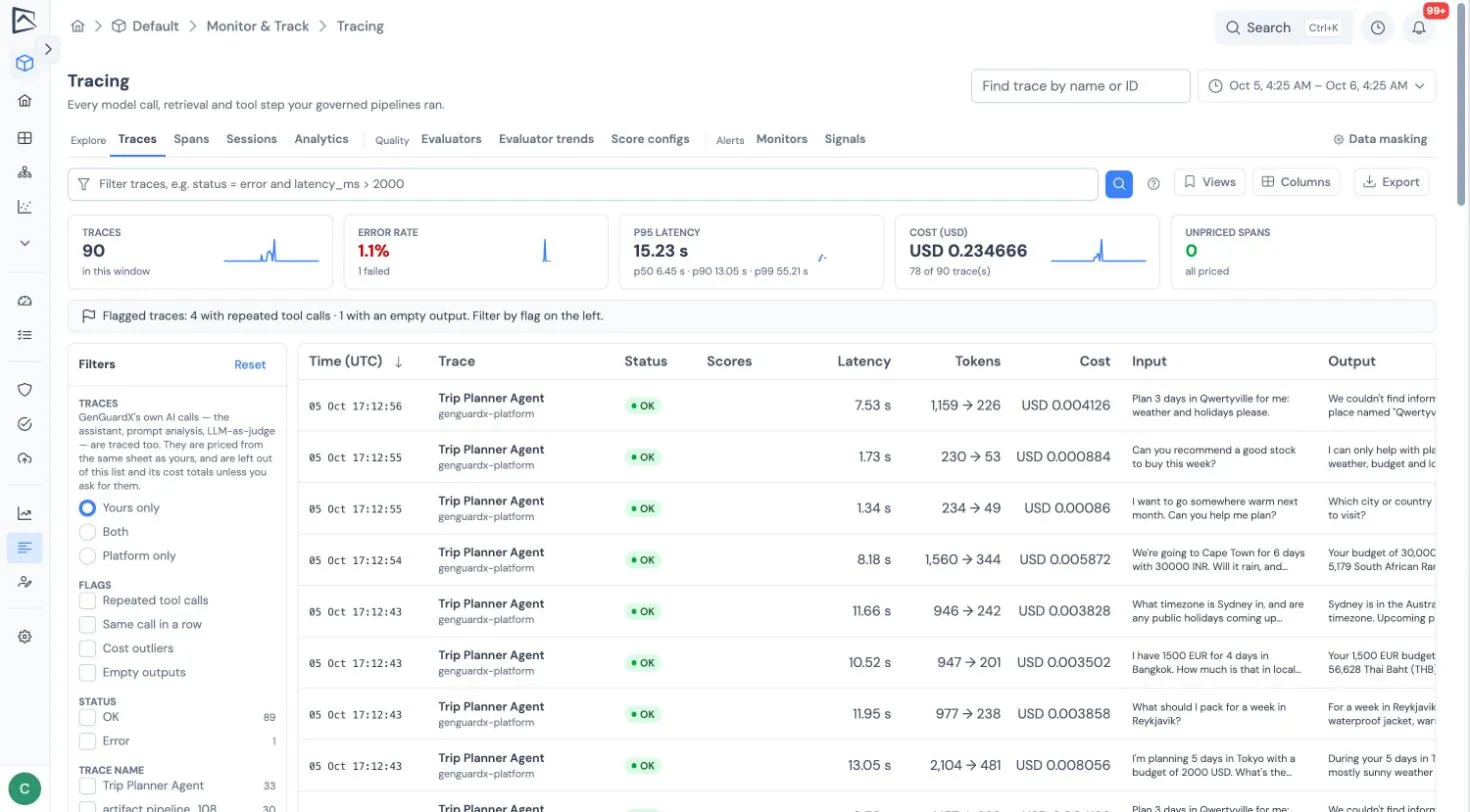
Open Monitor & Track → Tracing. The tabs come in three groups, with one setting at the end:
- Explore: Traces, Spans, Sessions and Analytics, for finding and reading what your systems did.
- Quality: Evaluators, Evaluator trends and Score configs, for judging it. See Evaluators and Scores and feedback.
- Alerts: Monitors and Signals, for being told when something goes wrong. See Monitors and Governance signals.
- Data masking, the project’s setting for what is hidden before anything is stored. See Data masking.
The trace list shows what each trace was asked and what it answered, next to its status, scores, latency, tokens and cost; hover a preview for the full text. Models, spans and session are in the Columns menu. A session reads as the conversation it was, turn by turn, with each turn’s raw request and response a click away.
Choosing a time range
Section titled “Choosing a time range”The range picker offers the last 15 minutes, hour, 12 hours, day, 7 days, 2 weeks, month, 3 months or 6 months, or any custom days and clock times. Times can be shown in UTC or your local time zone. Last 15 min refreshes itself every 30 seconds. Your chosen range stays with you as you move between tracing pages, and a link you share carries the range it was taken with.
The trace list
Section titled “The trace list”- Summary tiles show the number of traces, the error rate, latency (95th percentile, with the 50th, 90th and 99th beneath it), total cost per currency and how many spans could not be priced.
- Each row shows the trace’s name, a preview of its input and output, status, scores and evaluations, latency, tokens, cost, the models and step kinds it used, and its session and user.
- Filters narrow the list by environment, status and trace name (with counts), by score or evaluation (a range, yes/no or a label), and by an exact session or user id. The search box matches trace names or a pasted trace id. For anything more specific, use the query box.
- Platform traces, the cost of GGX’s own AI features including evaluator judges, are kept out of your totals unless you choose Both or Platform only.
A single trace
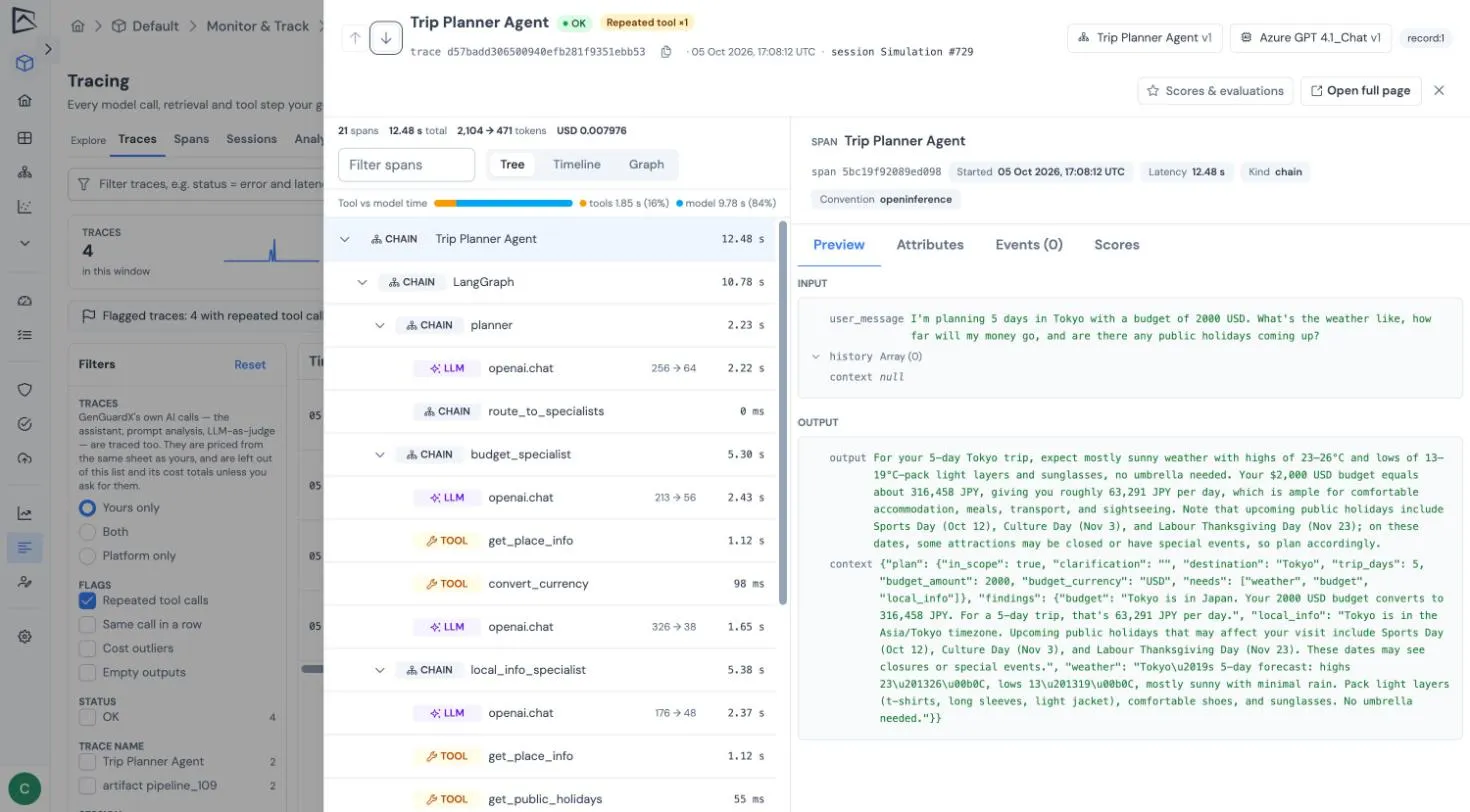
Section titled “A single trace”Selecting a trace opens it in a panel over the list, so you can read it and carry on down the list:
- The arrows in the panel’s header step to the previous or next row.
- Esc or the close button returns to the list.
- Open full page gives the trace the whole screen.
- The panel’s address can be shared, and Back closes it.
Traces opened from the Spans tab open on the span you picked, and a session’s turns open the same way.
A trace shows its spans as a tree, on a timeline, or as an agent graph, with the project, deployment, agent version and the prompts, retrievers and models it declared.
On the full page, arrows in the header step to the previous or next trace of the same session or week, and the session link opens the conversation the trace belongs to.
The span inspector
Section titled “The span inspector”Selecting a span opens the inspector, which has four tabs.
Preview renders chat messages by role and inputs and outputs as readable text, with an Errors section when the step failed.
Attributes shows everything recorded for the step as one document, laid out the way OpenInference and Arize lay it out: its name, IDs, times and latency, status, kind, input and output, model, token counts, cost, tool, agent, session and user, then your own attributes and the resource’s, nested by their dotted names, and the step’s scores and evaluations under evals (the first step of a trace also carries the trace’s own).
- Fold and unfold any part of the document.
- Type in the search box to keep only the keys and values that match, opened up to show them.
- Use Copy as JSON to copy the whole document.
- A value GGX read out of one of your attributes, such as the model, says where it came from, for example from
gen_ai.request.model. The document’slifted_fromlists them all. Steps recorded before 25 Sep 2026 do not say where their values came from. - Turn on Show only unmapped to see just the attributes GGX did not read into its own fields, and the resource’s.
Events lists what the instrumentation recorded during the step, in order.
Scores lists the step’s scores and evaluations, adds a score, and runs an evaluator on it.
Errors and data quality
Section titled “Errors and data quality”Why a step failed
Section titled “Why a step failed”When a step fails, the inspector’s Errors section shows the exception type, its message and the stack trace, all masked like any other content. A trace is marked as an error when any of its spans failed, even if the step around it reported success.
Instrumentation you can trust
Section titled “Instrumentation you can trust”GGX flags spans whose data would quietly skew your numbers:
- No token usage: a model call that names a model but reports no tokens. It cannot be priced, so its cost would silently drop out of totals.
- No model: a model call that does not say which model it used.
The trace list shows a Data quality note with the count of flagged spans in your range, and the inspector marks each one. The inspector also shows First token, the time until the model started responding, when your instrumentation reports it.
What to read next
Section titled “What to read next”- Search, analytics and export: query traces and spans, chart them, and export the results.
- Agents and sessions: the agent graph, trajectory flags and conversations.