

Agent Observability
Agent observability in GGX: trace every LLM call, tool call, retrieval and autonomous agent decision, then mask, price, score, evaluate, monitor and keep it as evidence.
Agent observability shows what your agents did in production and why. GGX records each request your agents and deployments handle as a trace that covers every LLM call, tool call, retrieval and autonomous decision the agent made along the way. You can open a trace, mask it, price it, score it, evaluate it and keep it as evidence. These pages cover what is captured, how to send it, and how to work with it once it is in.
In the app, agent observability lives under Monitor & Track → Tracing.
Traces, spans and sessions
Section titled “Traces, spans and sessions”These pages follow one example throughout: a Card Replacement Assistant, a chat agent that helps cardholders block a lost card and order a new one.
Everything GGX records sits at one of three levels, each nested inside the one above: a session holds traces, and a trace holds spans.
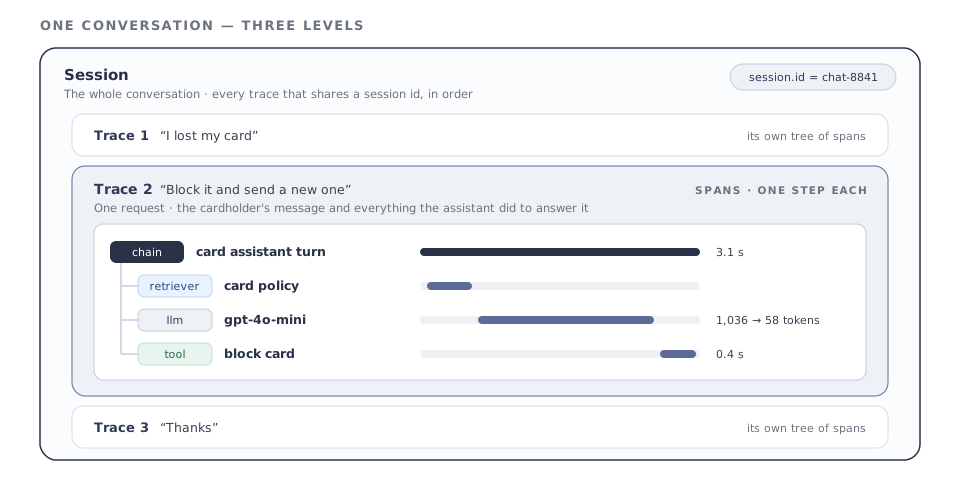
| Level | What it is | In the example |
|---|---|---|
| Session | The whole conversation: every trace that shares a session id, in order. | One cardholder’s chat, from “I lost my card” to “Thanks”. |
| Trace | One request: a message and everything the assistant did to answer it. | “Block it and send a new one” and the work behind the reply. |
| Span | One step inside a request: an LLM call, a retrieval, a tool call, an agent deciding what to do next, or a chain that groups them. | The call to gpt-4o-mini, the card policy lookup, the block card tool. |
A span can contain other spans, which is how a trace becomes a tree: in the figure, the card assistant turn chain contains the retrieval, the LLM call and the tool call. LLM calls carry tokens and cost; every span carries its timing and status.
What gets captured
Section titled “What gets captured”For every span GGX keeps:
- its name, kind, start and end, and status
- the model and provider, for model calls
- input and output, masked by your project’s data masking policy
- token counts, including cached and reasoning tokens
- time to first token, where the instrumentation reports it
- errors
- cost
Each trace also records which project, deployment and agent version it belongs to, so every run can be traced back to the approved asset that produced it.
Where to go next
Section titled “Where to go next”Start here
- Sending traces: the Python SDK, your own tools, agent frameworks and any OpenTelemetry exporter.
- Data masking: what is hidden before anything is stored, and how to manage a project’s policy.
Use it
- Exploring traces: the trace list, a single trace, the span inspector, errors and data quality.
- Search, analytics and export: the query language, the Spans tab, metadata dimensions, charts, saved views and export.
- Agents and sessions: the agent graph, trajectory flags, conversations and simulation jobs.
- Scores and feedback: reviewer scores, score configs and end-user feedback from your application.
- Evaluators: judges that record a verdict on live traffic.
- Monitors: thresholds on traffic, latency, cost and quality, with alerts.
- Governance signals: findings GGX files when it sees a risk in your traces.
Operate it
- Cost and retention: price sheets, retention, sampling and access.
- API reference: the tracing endpoints.