

Agent Observability
Monitors
Set up LLM monitoring alerts in GGX: monitors on trace volume, error rate, latency, cost, tokens, agent flags and evaluator scores, with email and Slack notifications.
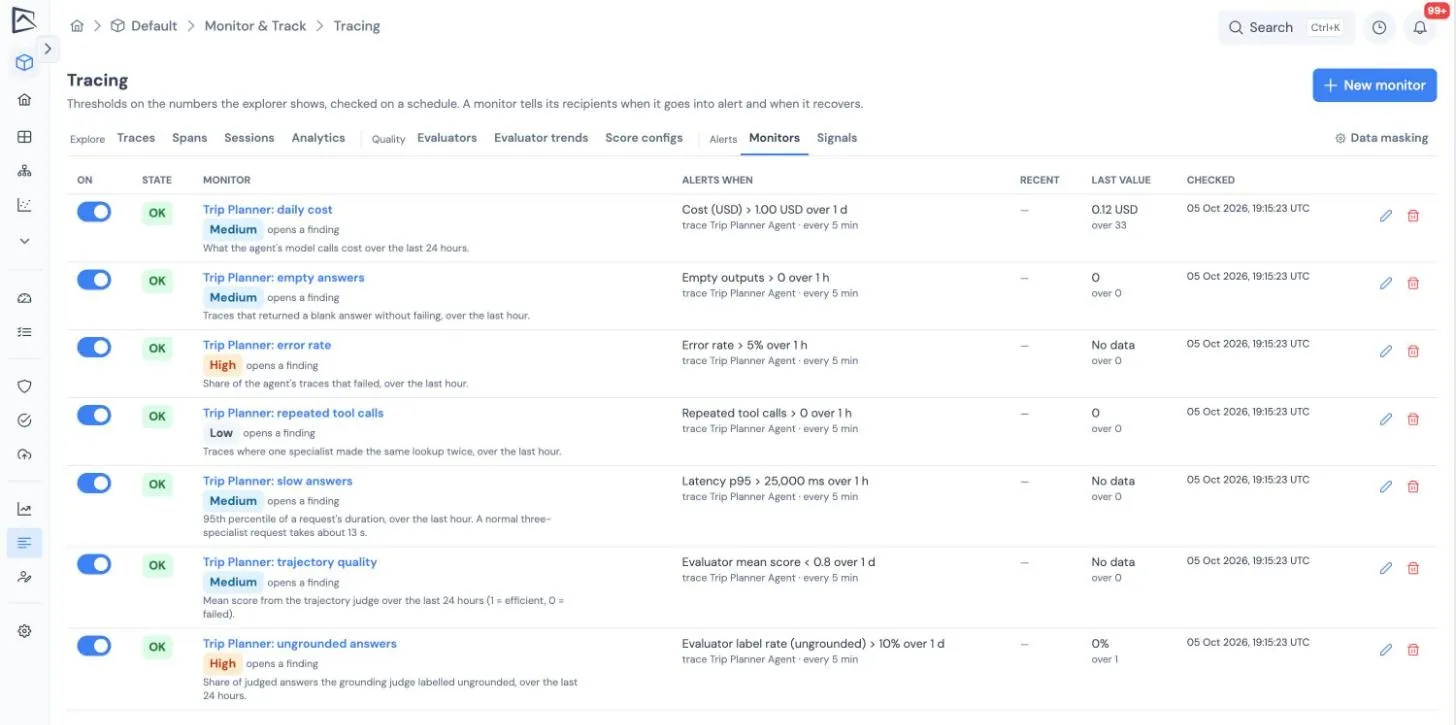
A monitor watches one measure of your traffic and tells you when it crosses a line you set. It is checked on a schedule, so you hear about a problem without watching the dashboard.
What you can monitor
Section titled “What you can monitor”| Group | Measures |
|---|---|
| Traffic and errors | Trace count, error count, error rate |
| Latency | 50th, 90th, 95th and 99th percentile |
| Cost and tokens | Cost per currency; input, output and total tokens |
| Agent flags | Repeated tool calls, same call in a row, cost outliers, empty outputs |
| Data quality | Spans with no token usage, spans with no model, masked spans |
| Quality | An evaluator’s mean score or the share of a label; a score’s mean or the share of a label |
A monitor can be narrowed to an environment, trace name, deployment or agent version. The numbers are computed exactly as the trace list’s summary tiles compute them, so a monitor and the dashboard never disagree.
Creating a monitor
Section titled “Creating a monitor”- Open Tracing → Monitors and choose New monitor.
- Pick the measure and any filters.
- Set the condition:
- a comparison: above, at least, below or at most
- a threshold
- the window it is measured over, from 5 minutes to 7 days
- how often to check
- how many checks in a row must breach before it alerts
- an optional minimum number of traces
- a severity
The builder shows the measure’s current value as you edit.
A measure over no traffic counts as no data and changes nothing, except a count: a trace count below 1 is how you catch traffic stopping.
Alerts
Section titled “Alerts”- A monitor moves from OK to Alerting after the set number of breaching checks in a row, and back to OK after the same number of healthy ones. Each change is recorded in its history.
- Alerts go to chosen people in GGX and by email, and to the monitor’s own Slack incoming webhook if you add one. Recipients must be able to read the project. Alerts carry the measure, its value and a link, never trace content.
- You can mute a monitor for an hour, 8 hours, a day or a week, acknowledge an alert, and unmute early. A muted monitor that is alerting shows Muted · alerting, and unmuting it while still alerting sends a reminder.
- Editing what a monitor measures, or switching it off and on, starts it afresh at OK, with a note in its history and no alert.
- A monitor can also open a governance finding when it alerts.
What to read next
Section titled “What to read next”- Governance signals: findings GGX files on its own, without a threshold from you.
- Search, analytics and export: chart the same measures over time.
- Evaluators: produce the quality measures a monitor can watch.