

Has problems
Route the finding to the responsible developer or team. GGX can create or link a Jira ticket according to the organization’s routing and deduplication policy.
Technology
Benchmark GGX monitoring at scale across observability ingestion, heuristic triage, parallel LLM judges, automated routing, and targeted human review.
GGX is designed to monitor large fleets of production AI applications. It can partition independent conversations, execute heuristic and LLM-based checks concurrently, and distribute the work across threads, processes, and multiple worker machines.
This page presents GGX benchmarks for an example scenario. Use the results as estimates that you can adapt to your workload.
Consider an organization deploying many AI applications for internal teams and external customers:
conversations
per agent/day
conversations
/day
turns/day
at ~5 turns per chat
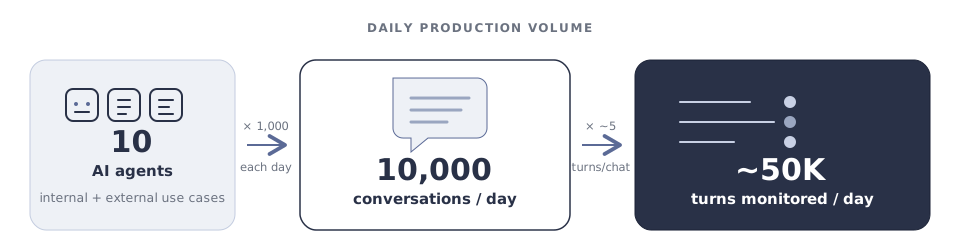
Assuming the agents are active for approximately 12 hours per day, this averages about 14 conversations per minute or 1.2 turns per second. Real systems are bursty, so peak throughput may be higher.
gemini-3.5-flash, claude-4.5-haiku, or gpt-4o-mini.The tests ran on a machine with the following specifications:
hi request returned in approximately 400 ms.The benchmark ran five judge types for each record:
The values below are the measured wall-clock results using Gemini 3.5 Flash.
Increasing the thread count from 8 to 32 (4× more threads) produced an approximate 2–3x speedup for batches of 100 records or more. For 100 records, this reduces the workload from up to 13 groups of 8 concurrent records to 4 groups of up to 32 concurrent records.
| # Threads | Records | Time | Time/record | Throughput |
|---|---|---|---|---|
| 8 threads | 1 | 1.5 sec | 1.520 sec | 0.66 records/sec |
| 8 threads | 10 | 6 sec | 0.632 sec | 1.58 records/sec |
| 8 threads | 100 | 39 sec | 0.390 sec | 2.56 records/sec |
| 8 threads | 1,000 | 381 sec | 0.381 sec | 2.62 records/sec |
| 8 threads | 10,000 | 3,182 sec | 0.318 sec | 3.14 records/sec |
| 32 threads | 1 | 1.5 sec | 1.549 sec | 0.65 records/sec |
| 32 threads | 10 | 5 sec | 0.551 sec | 1.82 records/sec |
| 32 threads | 100 | 16 sec | 0.160 sec | 6.23 records/sec |
| 32 threads | 1,000 | 135 sec | 0.135 sec | 7.40 records/sec |
| 32 threads | 10,000 | 1,236 sec | 0.124 sec | 8.09 records/sec |
Across the measured batches of 100 to 10,000 records, the aggregate wall-clock improvement is approximately 2.6x.
The following chart breaks down the 100-record measurement by judge.
The preceding numbers cover 10,000 records evaluated by five judges each. Because not every record requires five judges in a real-world workflow, the following section extrapolates the results to a more representative monitoring scenario and its business impact.
GGX turns raw production conversations into actionable assignments in three processing stages: Heuristic tests, LLM-based tests, and Assignment.
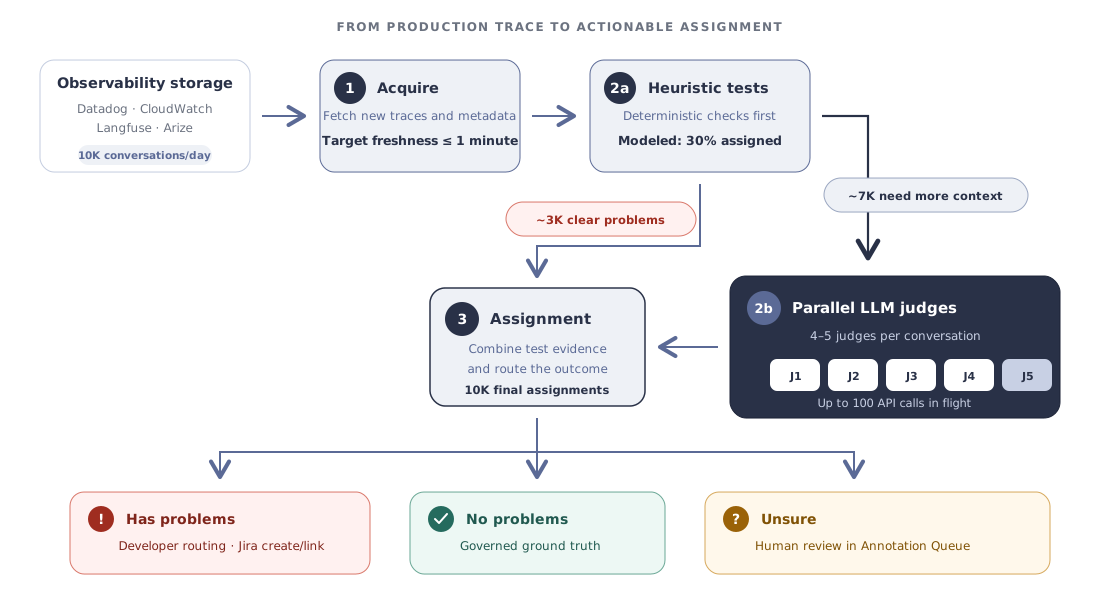
| Stage | Workload | What GGX does |
|---|---|---|
| 1. Acquire | 10,000 chats/day | Fetches new traces and metadata from observability storage. |
| 2a. Heuristics | About 3,000 chats | Runs deterministic checks for clear policy, safety, cost, latency, format, or known failure conditions. |
| 2b. LLM judges | About 7,000 chats | Runs 4–5 independent judges only where heuristics are insufficient. |
| 3. Assignment | 10,000 outcomes | Routes each conversation to the appropriate operational destination. |
The benchmark uses three final assignments:
Has problems
Route the finding to the responsible developer or team. GGX can create or link a Jira ticket according to the organization’s routing and deduplication policy.
No problems
Add the accepted conversation to ground truth managed through the GGX Datasets page.
Unsure
Send the ambiguous conversation to a human reviewer in a GGX Annotation Queue.
Conversation-level monitoring is naturally parallel: one conversation can usually be evaluated independently of another. GGX partitions work by tenant, agent, time window, or conversation, then scales each execution stage independently.
The slowest part of the monitoring workflow is typically the LLM-as-judge calls. Because these are network calls, they generally place a low burden on CPU and memory.
Work can be divided among local execution threads/processes and scaled horizontally across worker machines. The useful concurrency is bounded by the allocated infrastructure and downstream LLM provider limits.
The judge stage is expected to dominate wall-clock time because GGX adds less than 5% overhead to LLM-judge execution time.
Under the benchmark assumptions:
7,000 conversations × 4–5 judges × judge latency
number of concurrent calls
For this estimate, we conservatively assume approximately 10 concurrent LLM calls. Actual concurrency depends on the LLM provider’s quota limits.
| Judge profile | Time | Throughput | Projected time |
|---|---|---|---|
| Lower complexity | 200 ms | 50 calls/sec | ~ 12 min |
| Higher complexity | 1 sec | 10 calls/sec | ~ 50 min |
GGX automates the high-confidence decisions and reserves human attention for conversations classified as Unsure. This reduces review volume without removing human oversight from ambiguous or high-risk cases.
At 2 minutes per conversation, manually reviewing all 10,000 daily conversations would require 20,000 reviewer-minutes, or about 333 reviewer-hours per day. With GGX, human effort is proportional to the final uncertainty rate rather than total production volume:
| Uncertain chats | Records/day | Reviewer time/day |
|---|---|---|
| 1% | 100 | 3 hr 20 min |
| 5% | 500 | 16 hr 40 min |
| 10% | 1,000 | 33 hr 20 min |
The uncertainty rate is a result to measure, not a target to force downward. A lower escalation rate is only useful when heuristic and judge assignments continue to meet validated quality thresholds.
The automated feedback loop converts monitoring data into ground truth and tracked issues, which can reduce uncertainty over time.
Judges can use prior ground truth and identified issues as context for refinement. Over time, this can help align judge behavior with reviewer expectations.