
Evaluate and Approve
Reporting
How reports are built in GGX — metadata, data schema, parameter schema, computation, and visualization — plus how to register, test, and reuse them.
What is a Report?
Section titled “What is a Report?”A report is an analytical entity that turns the output of a job into insight. It reads a data source, applies computation logic (statistics, grouping, filtering, model-based scoring), and presents the result through visual elements such as charts, tables, and narrative summaries — helping stakeholders make data-driven decisions.
Once registered, a report becomes a reusable asset: the same report can be run against many objects (Agents, Models, RAGs, Prompts) and combined with others into use-case-specific dashboards.
Anatomy of a report
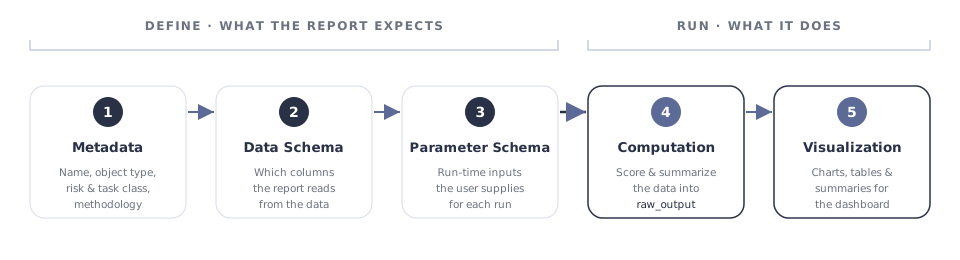
Section titled “Anatomy of a report”Every report is made of five building blocks — three that define what the report expects, and two that hold the logic it runs.
1. Metadata
Section titled “1. Metadata”Metadata is the descriptive header of the report — how it is named, classified, and discovered on the Reports page. Only the Name is required up front; the classification fields can be left empty and filled in later.
| Field | Required | What it captures |
|---|---|---|
| Name | required | Human-readable name of the report. |
| Object Type | required | The kind of object the report runs on (Foundation Model, Agent, RAG, Prompt, …). |
| Description | optional | What the report measures and how to read it. |
| Risk Type | optional | The risk category the report addresses (e.g. Accuracy, Bias, Toxicity, Vulnerability). |
| Task Type | optional | The task being evaluated (e.g. classification, summarization, retrieval, generation). |
| Risk Domain | optional | The governance lens — MRM, Fair Lending, Business/Tech, and so on. |
| Evaluation Methodology | optional | How the metric is computed: LLM-as-a-Judge, NLP / ML Algorithms, Rule-based, or Others. |
2. Data Schema
Section titled “2. Data Schema”The Data Schema declares the columns the report needs from the job output. It is the contract between a report and the objects it can run on: any object whose output provides these columns can use the report. Each entry has a column name, a mandatory flag, and a description.
{ columnName: string; // the column the report reads mandatory: boolean; // must the data provide it? description: string; // what the column holds}For example, a response-accuracy report might expect:
| Column | Mandatory | Description |
|---|---|---|
output |
Yes | The response produced by the object under test. |
expected_answer |
Yes | The ground-truth answer to compare against. |
context |
No | Retrieved context passed to the model (used for grounding checks). |
3. Parameter Schema
Section titled “3. Parameter Schema”The Parameter Schema lists the inputs a user supplies at run time — thresholds, category choices, the evaluator model to use, and so on. The platform renders each parameter as a form control based on its type, and the values arrive in the computation as job.parameters.
{ key: string; // name used in code, e.g. job.parameters["threshold"] label: string; // shown in the run form type: 'numberbox' | 'textbox' | 'selectbox' | 'selectbutton'; placeholder: string; description: string; defaultValue: string; options: string[]; // choices for selectbox / selectbutton required: boolean;}[]type |
Renders as | Use for |
|---|---|---|
numberbox |
Numeric input | Thresholds, top-k, temperatures (e.g. 0.5). |
textbox |
Free-text input | Labels, column names, free-form values. |
selectbox |
Dropdown | One choice from a longer list (options). |
selectbutton |
Button group | One choice from a short set of options. |
For example, a single pass/fail threshold:
[ { "key": "threshold", "label": "Pass threshold", "type": "numberbox", "placeholder": "0.7", "description": "Minimum score for a response to count as correct.", "defaultValue": "0.7", "options": [], "required": true }]4. Computation
Section titled “4. Computation”The computation is where the report does its work. The platform hands it two values:
data— the job output as a DuckDB DataFrame. It always holds the object’s input columns plus its output. What the output looks like depends on the object: a chat/LLM object, for instance, emits anoutputstring and anycontextthe author chose to surface ({"output": str, "context": ...}).job— a handle to the run and its context:job.parameters(the values from the Parameter Schema),job.current(the object under test), andjob.current.name(its name).
You can operate on data with DuckDB directly, or call data.df() to convert it to a pandas DataFrame and work in pandas — the logic below is written the same way either way.
Whatever the computation produces is passed to the visualization step as raw_output. It can be a single DataFrame or a dict of DataFrames:
# `data` (a DuckDB DataFrame) and `job` are provided by the platform.df = data.df()                                # convert to pandasthreshold = float(job.parameters["threshold"] or 0.7)
# Score each row, then summarize.scored = df.assign(    correct=lambda d: similarity(d["output"], d["expected_answer"]) >= threshold)summary = (    scored.groupby("correct").size()          .rename("count").reset_index())
# The value of the computation is exposed to visualization as `raw_output`.raw_output = {"scores": scored, "summary": summary}
5. Visualization
Section titled “5. Visualization”Each visualization runs on the output of the computation, available as raw_output. A report can have several outputs — add more with the Add Output button — and each returns one of:
- a Plotly figure — charts and interactive graphics;
- a pandas / DataFrame — rendered as a sortable, filterable grid table with no extra code;
- an HTML / Markdown string — narrative summaries, executive overviews, formatted callouts.
import plotly.express as px
# `raw_output` and `job` are provided by the platform.summary = raw_output["summary"]
fig = px.bar(    summary, x="correct", y="count",    title=f"{job.current.name} — response accuracy",)fig  # returning a Plotly figure renders it as a chart
A metric-style output simply returns a numeric value.
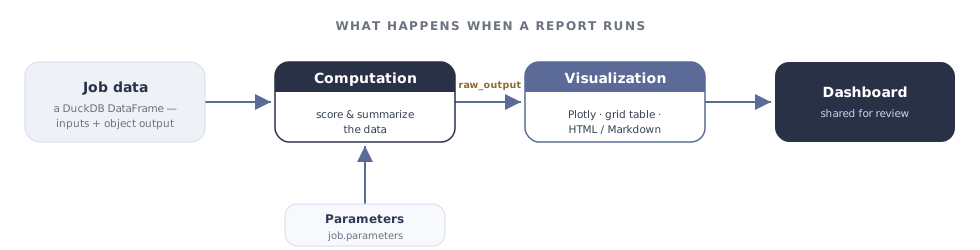
raw_output feeds each visualization; the figures assemble into a dashboard.Benefits of report registration
Section titled “Benefits of report registration”- Customize reports to meet MRM, Fair Lending, Business, and Development requirements.
- Combine multiple reports into use-case-specific dashboards while running jobs.
- Track all modifications with enhanced version management.
- Collaborate and approve with MRM, FL, and other team members.
- Track usage through the Lineage Tracking capability.
- Reuse across cases to avoid repeating the approval process.
- Make quick updates as needs and business logic change.
Registering a report
Section titled “Registering a report”The Reports page organizes every report in one place for easy tracking, monitoring, and creation. To register a new one, go to Data & AI Assets → Reports and click Create, then work through the five building blocks:
-
Fill in the metadata. Give the report a Name and choose the Object Type it runs on. Add a Description, and — now or later — the Risk Type, Task Type, Risk Domain, and Evaluation Methodology. Optionally assign a Group (for organization) and an Approval Workflow (the chain for moving from Draft to Approved).
-
Declare the Data Schema. List the columns the report reads, marking each mandatory or optional. These are the columns the object’s output must provide.
-
Declare the Parameter Schema. Add the run-time inputs, choosing a control type (
numberbox,textbox,selectbox,selectbutton), a default, options where relevant, and whether each is required. -
Provide example data. Attach a sample dataset — from a registered table or an uploaded file — so the report can be run and validated during authoring.
-
Write the computation. Read
dataandjob, compute your metrics and tables, and return them (a DataFrame or a dict of DataFrames). Select any additional resources (Global Functions, Models, evaluator LLMs) the logic needs. -
Write the visualization(s). Turn
raw_outputinto figures — Plotly charts, grid tables, or HTML/Markdown. Use Add Output for more than one figure. -
Add notes or attachments, then click Create to finalize registration.
Testing a report with a Simulation job
Section titled “Testing a report with a Simulation job”A report can be validated on its own before it is trusted for governance. Run it through a Simulation job with representative data and known expected outputs, then confirm the numbers and visuals come out as intended. Because the report is just an asset, the same run doubles as evidence you can attach to an Approval Workflow.
Once validated, the report is ready to be selected when running jobs on other objects — the dashboard is produced automatically when the job completes.
Reusing reports across agents
Section titled “Reusing reports across agents”Because a report is written against the columns it expects (for example user message, response, and context), a single generic report can run across many agents or tables, while more specific reports capture bespoke metrics for one agent pattern — single-turn, multi-turn, RAG, and so on. A common layout is an HTML executive summary at the top, per-metric deep-dive figures, and a raw assessment table that stakeholders can export for further analysis.